
type
status
date
slug
summary
tags
category
icon
password
平时我们经常需要对我们的数据集进行各种分析,以便我们找到更好的提高方式。所以我将我平时分析数据集的一些方法打包发布在了Github上,分享给大家,有什么错误和意见,请多多指教!

图片数量、标注框数量、类别信息
这些信息会在终端打印出来,格式如下:
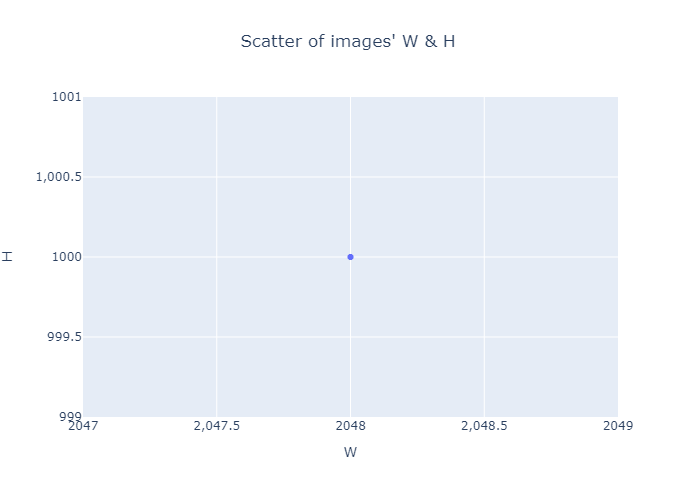
所有图片宽度和高度的散点图
这里只有一个点,是因为所有的图片尺寸相同
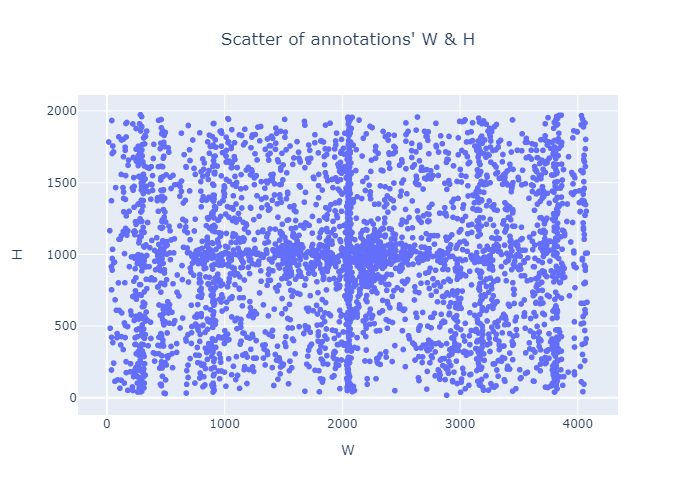
所有标注框宽度和高度的散点图
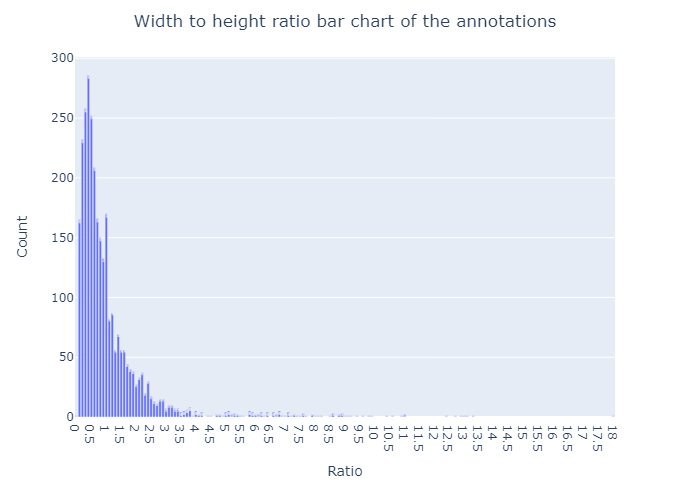
## 标注框宽度和高度之比 横坐标为比率,纵坐标为数量
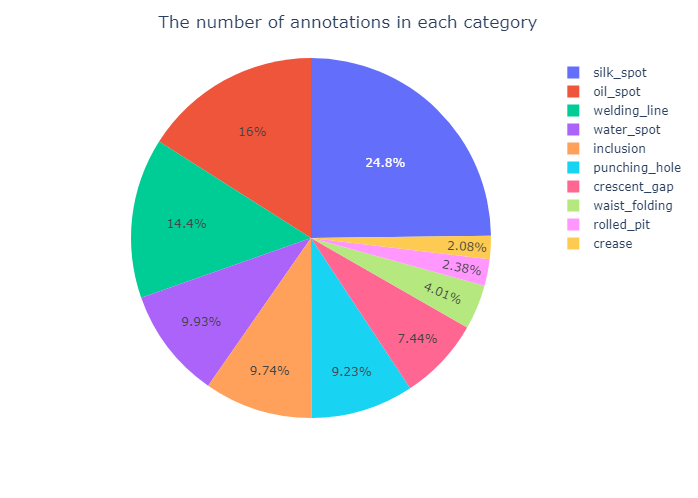
每一类的标注框数量
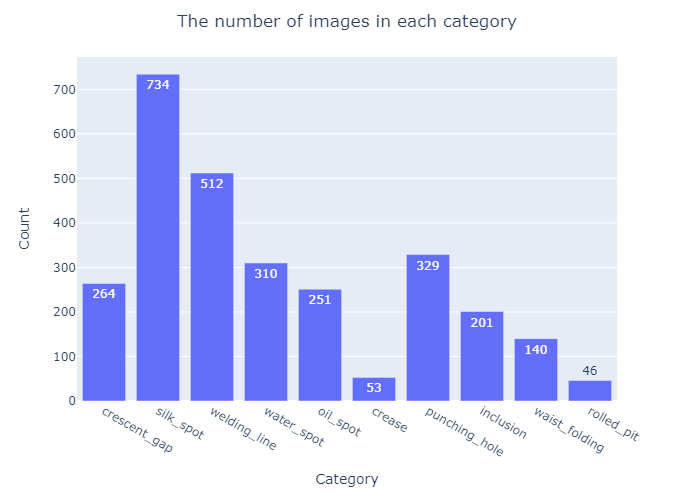
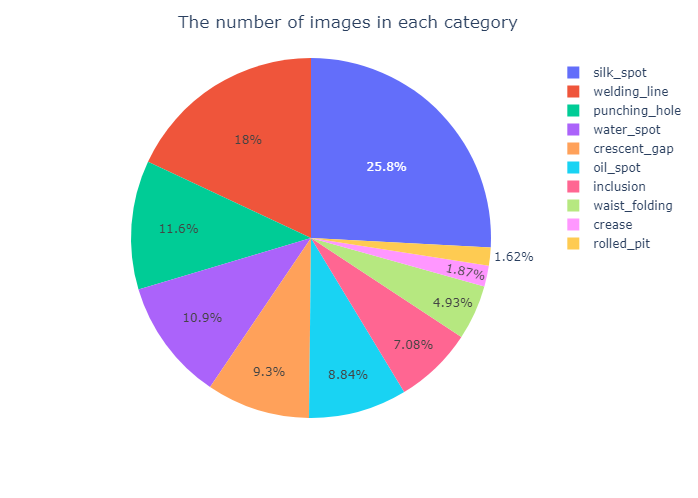
每一类图片数量

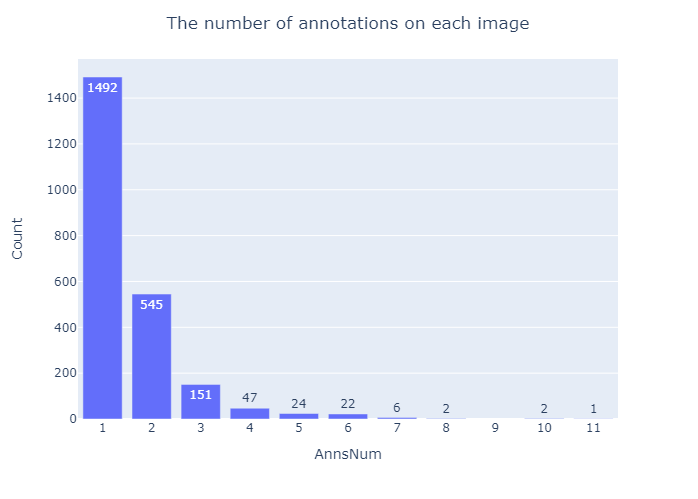
每一张图片上的标注框数量
横坐标为一张图片上的标注框数量,纵坐标为图片数量
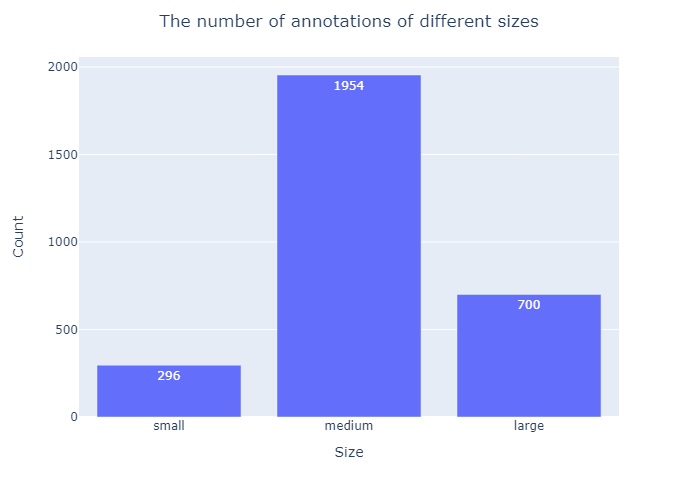
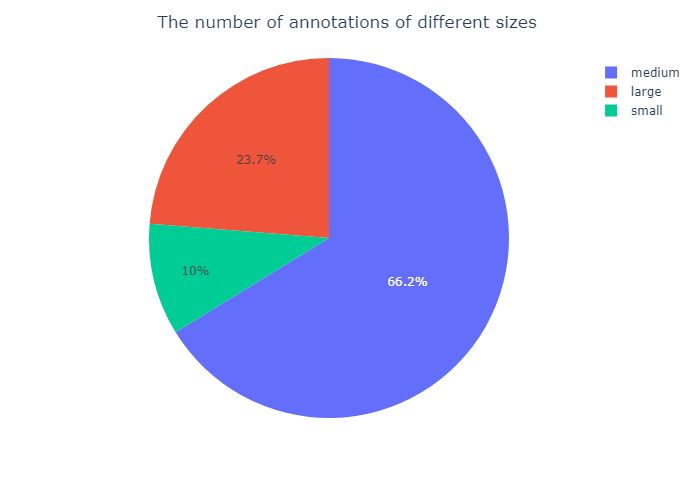
不同尺寸的图片数量
根据coco的划分规则计算
使用方法

Install
Usage
typeThe format of the dataset, optional ‘coco’ or ‘voc’.
pathThe path of dataset. Iftypeis ‘coco’, thepathis the json file path. Iftypeis ‘voc’, thepathis the path of the xml file directory.
-outis the output directory, default is ‘./out’
Example
- 作者:Ghlerrix
- 链接:https://ghlcode.cn/pages/250d97
- 声明:本文采用 CC BY-NC-SA 4.0 许可协议,转载请注明出处。
相关文章